Quick start
Get your first monitor running in under a minute.
1. Sign in
Go to your Vantaj dashboard and sign in with your email or Google account. On first sign-in, a workspace is created for you automatically.
2. Add a monitor
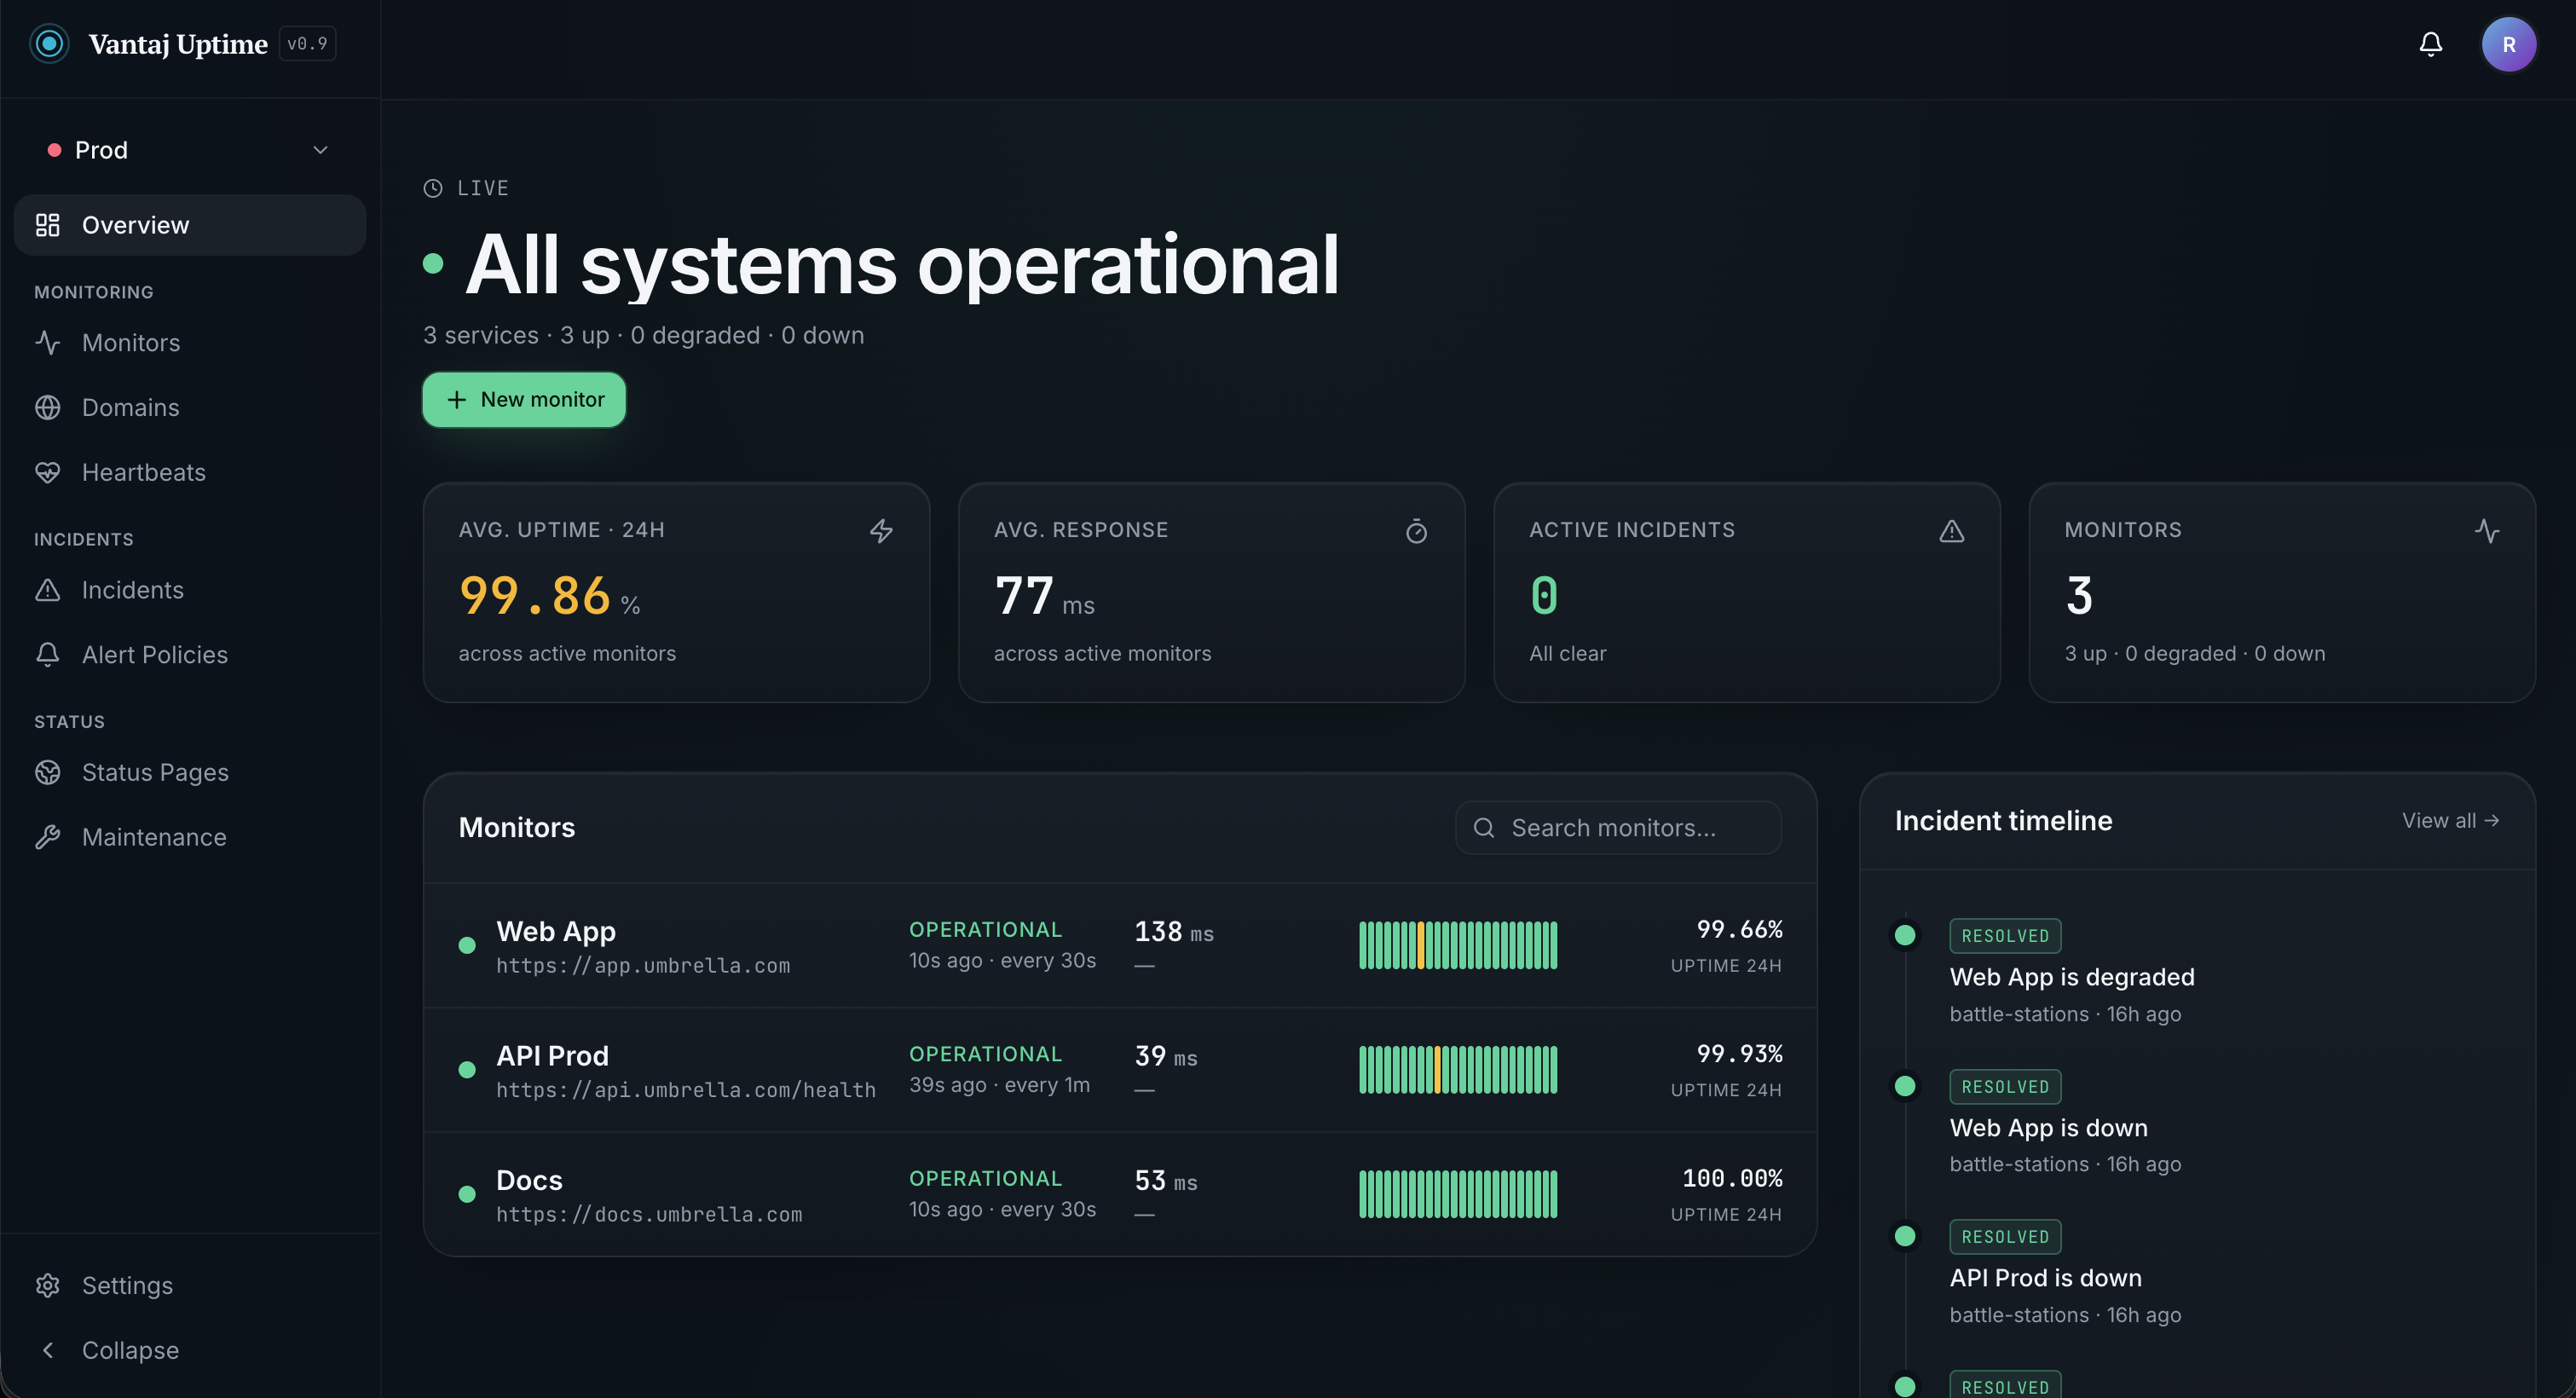
Click New monitor from the Monitors page or the dashboard.
Fill in:
- Display name — a human-readable label, e.g.
API Gateway - URL — the endpoint to check, e.g.
https://api.example.com/health - Monitor type — choose HTTP(s), Ping, or Port
- Check interval — how often to run the check (anything from every 30s to once a day)
- Group (optional) — assign to a group to organise related monitors
Click Create monitor. Vantaj begins checking immediately.
3. View results
Click the monitor row to open its detail page. You'll see:
- Overview — uptime %, response time, incident count, and last check time, all filterable by timeframe
- History — a full log of every check with status, region, and response time
- Alerts — attach an alert policy so you're notified when this monitor goes down
- Settings — edit the monitor or delete it
Get notified
A new monitor checks silently until you attach an alert policy. Set one up under Incidents → Alert Policies (pick your channels and escalation), then attach it from the monitor's Alerts tab. See Alerts & notifications.
4. Track a domain
Go to Domains in the left navigation and click Add domain. Enter any domain name — www. and https:// are stripped automatically. Vantaj looks up WHOIS/RDAP data and begins tracking the expiry date, registrar, and nameservers, refreshing every 24 hours.
5. Monitor a scheduled job
Go to Heartbeats in the left navigation and click New heartbeat. Give it a name, set how often your job is expected to run, and add a grace period to absorb brief delays.
Vantaj gives you a ping URL. Add a call to that URL at the end of your job — if the ping stops arriving, Vantaj marks the heartbeat as missed.
6. Pause or resume
You can pause any monitor from the Monitors list using the pause button that appears on row hover, or from the monitor's Settings tab. Paused monitors are skipped by the checker and shown at reduced opacity in the list.